


Thank you for all your hard work - your data has indeed helped a lot of people
As a retail investor, I frequently struggle to synthesize market data from disparate sources. Since becoming a HYDATA member, I can efficiently analyze real time quantified market and derivative data, enabling me to execute high probability trades with greater confidence
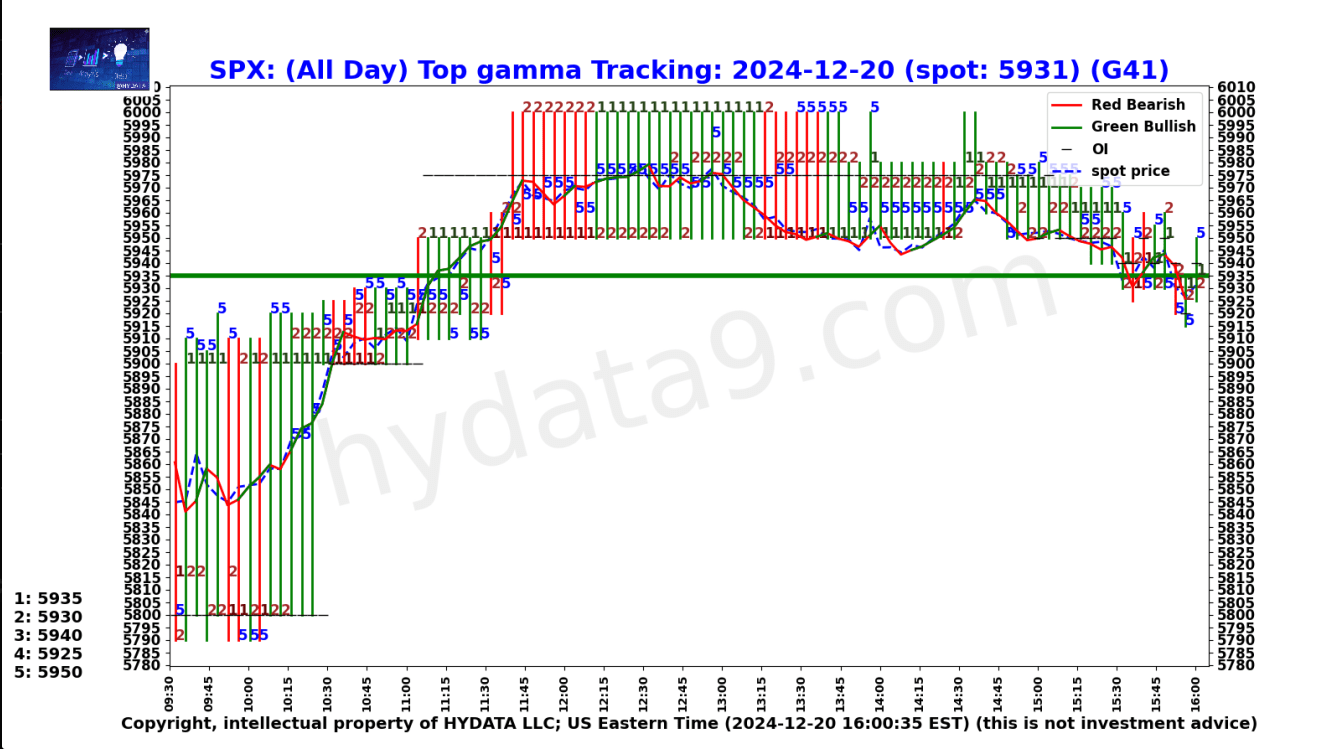
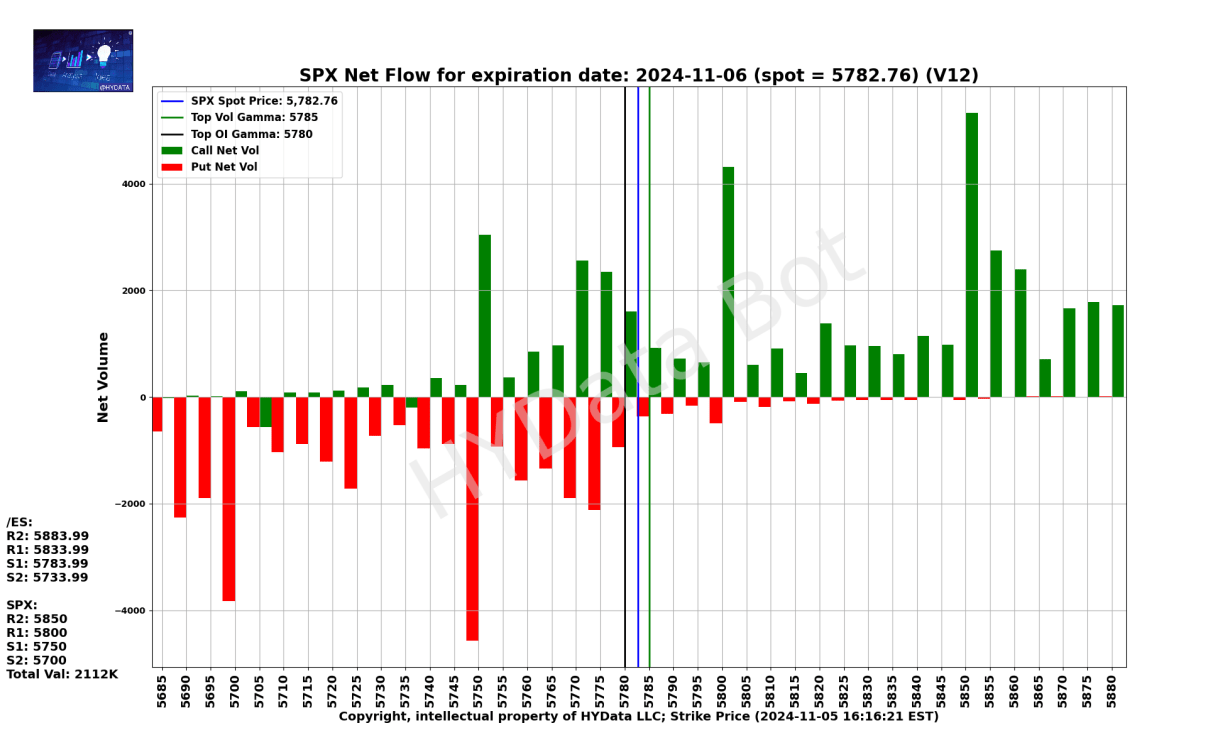
The top gamma for individual stocks is also super accurate. When you combine with NETFLOW changes, it is so easy to spot the support and resistance level of your target stocks.
I joined the Hydate group more than one year. The amount of valuable information in the Hydata such as the daily top gamma and individual stock data are super accurate, It really helps me to read the charts and doing my trade without pressure. Especially I really like to use the price bot , its accuracy has been amazing since I prefer being a buyer. I would like to thank you and your team for doing all of this and thank you very much for being such a good instructor.